Quantitative Data Analysis

Quantitative analysis of small samples can be challenging due to the limitations in statistical power and potential for increased variability. Hence results are not generalizable and offer only a foundation on which to conduct further studies. However, with careful planning and execution, you can still obtain valuable insights. Here are some guidelines on how to approach this:
1. Review Your Research Question (RQ)
Consider the separate elements: Be explicit about what you are testing. In our case, per our conference proposal and IRB in the OWLS-CARE project:
a. We are examining the impact of Intensive Learning Experiences (ILE) on
i. language proficiency,
ii. IC competence,
iii. peer attititudes and
iv. peer behaviors
b. We are also exploring the impact of Short-term groups (STG) on IEP to identify
i. Benefits as perceived by ??
ii. Disadvantages as perceived by??
iii. Suggestions for future partnerships and internationalization initiatives
Scope and Objectives of the Research Question (RQ): As we review the data, we look back to RQ re its scope and specific objectives and what you get from your data analysis.
2. Understand Your Data
Data Characteristics: Know the types and characteristics of the data – and store / analyze / organize data to preserve easy access; follow precise protocol in analysis.
For the quantitative data in this study, we have:
§ Pre- and post- language test scores (PPLT) (IEP n=9; STGs n=17)
§ Attitudinal survey responses (ASR) (All student participants n=8; Instructors ASR n=4)
A shortcut: look at the Qualtrics reports for the PPLT and ASR responses and note observations based on the RQ (step 1) and the criteria for descriptive statistics (step 3 below).
Sample Size Justification: Provide a rationale for the (small) sample size. Discuss the limitations and potential biases associated with small sample sizes.
3. Choose Appropriate Statistical Methods
Descriptive Statistics: Start with descriptive statistics to summarize your data. In textbook approaches, you’d calculate means, medians, standard deviations, and ranges. We may want to look at the following:
- What information of interest is being communicated in response to the prompt?
- What are extreme representations: what to most respondents say? What is the least occurrence?
- What is the surprising/interesting/thought-provoking response?
- What is missing?
- How does this relate back to the RQ?
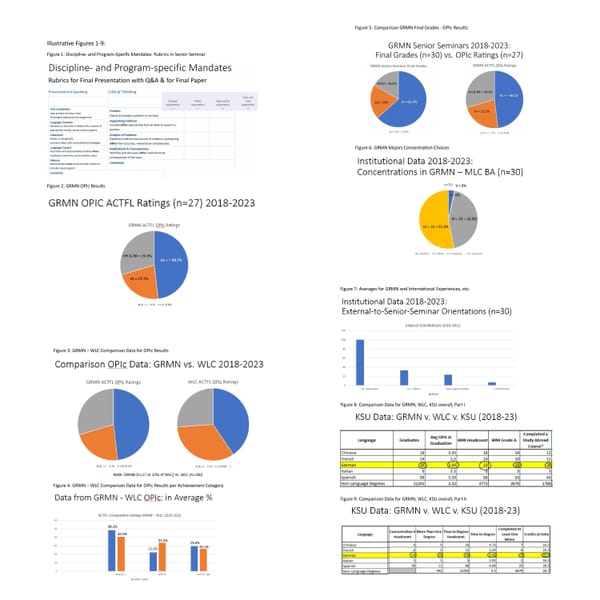
Visualizations: Use box plots, histograms, or scatter plots to visualize your most compelling data.
4. Perform the Analysis
Use Exact Methods: For very small samples, consider using exact methods (i.e., exactly what we have in Qualtrics reports).
5. Interpret and Report Results
Discussion of Findings: Address the findings from steps 3-4 and put them in connection with the RQ (step 1).
Discussion of Limitations: Address the limitations of your study due to the small sample size. Discuss how this impacts the generalizability of your results.
Recommendations for Future Research: Suggest areas for further research, especially studies with larger samples to validate your findings.
6. Ethical Considerations
Transparency: Be transparent about your data collection and analysis methods.
Reproducibility: Provide sufficient details so that others can replicate your study.
- References
Include references to scholarship that inform your methodological choices and contextualize your findings within the broader research landscape. Here are some key references:
- Cohen, J. (2013). Statistical Power Analysis for the Behavioral Sciences (2nd ed.). Routledge.
- Efron, B., & Tibshirani, R. J. (1993). An Introduction to the Bootstrap. Chapman & Hall/CRC.
- Field, A. (2013). Discovering Statistics Using IBM SPSS Statistics. SAGE Publications.
- Keller, G. (2017). Statistics for Management and Economics (11th ed.). Cengage Learning.


